Connect to industry leaders
Thanks to Smoobu, you can sync your website directly to Airbnb, Booking.com, Expedia, and more leading OTAs and booking sites.
All your data at a glance
Dashboard Overview
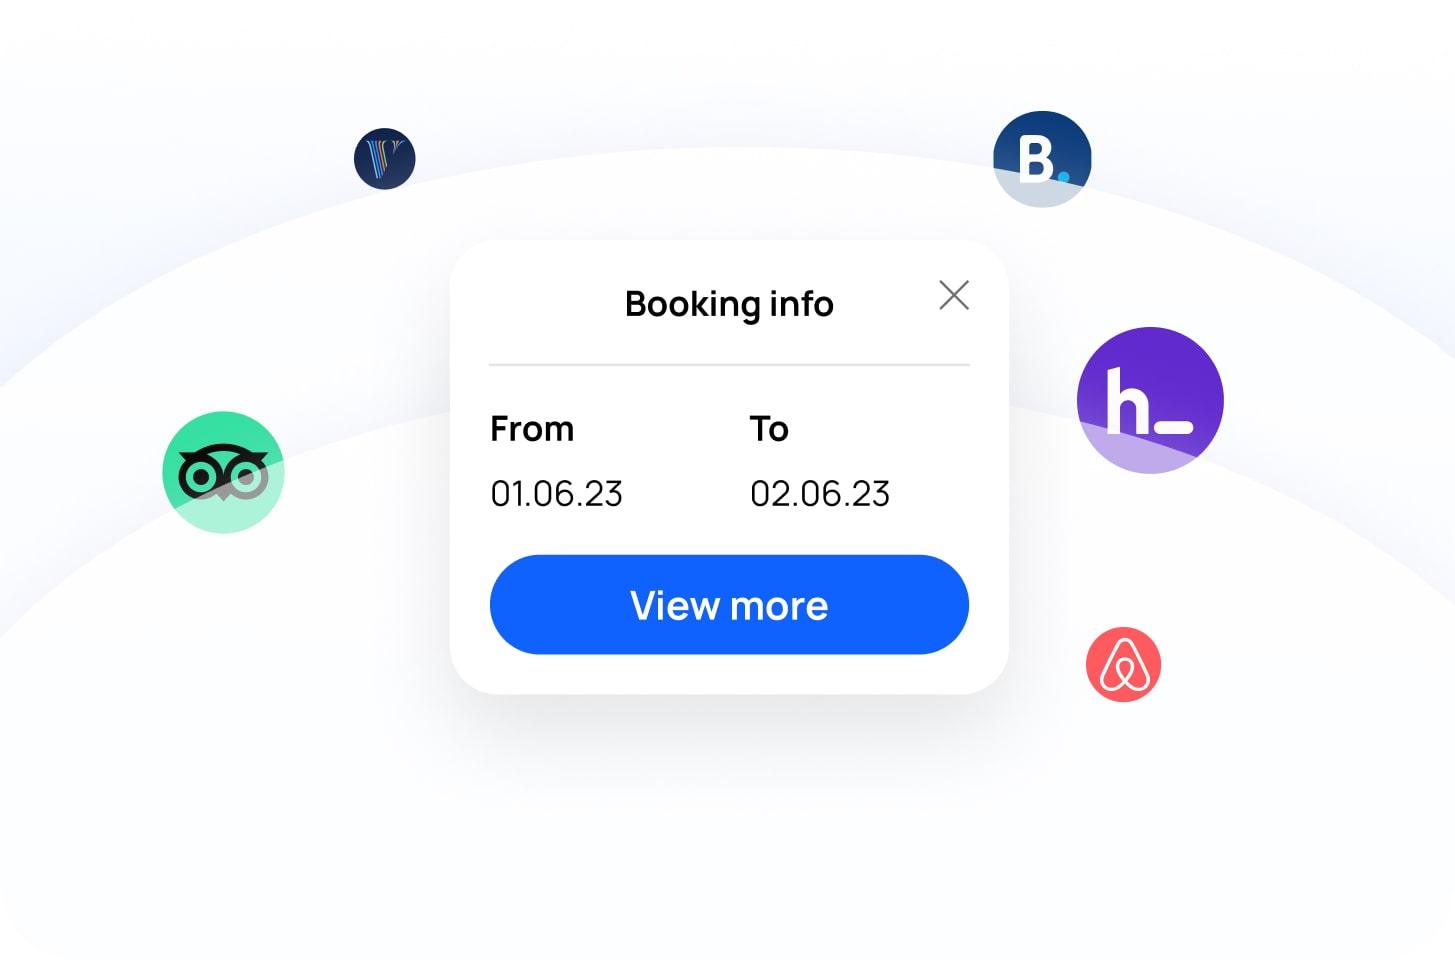
A bird's-eye view
Access all your booking data from connected platforms in one dashboard for easy monitoring.
Data Insights
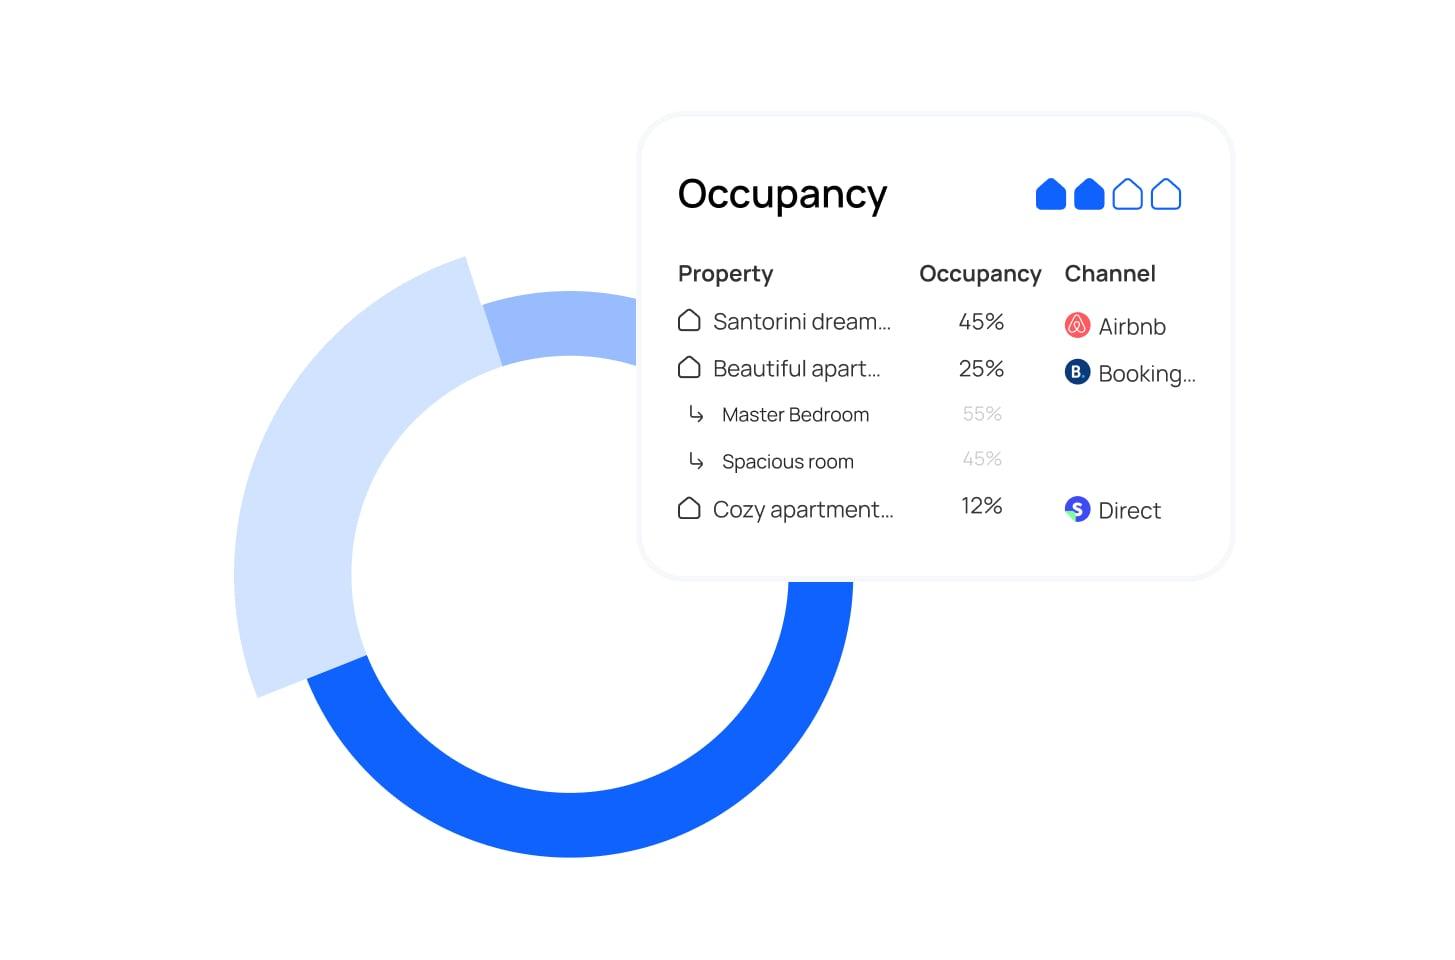
In-depth analysis
Examine occupancy rate, revenue, and booking trends across platforms to drive informed business decisions.
Smart Filters
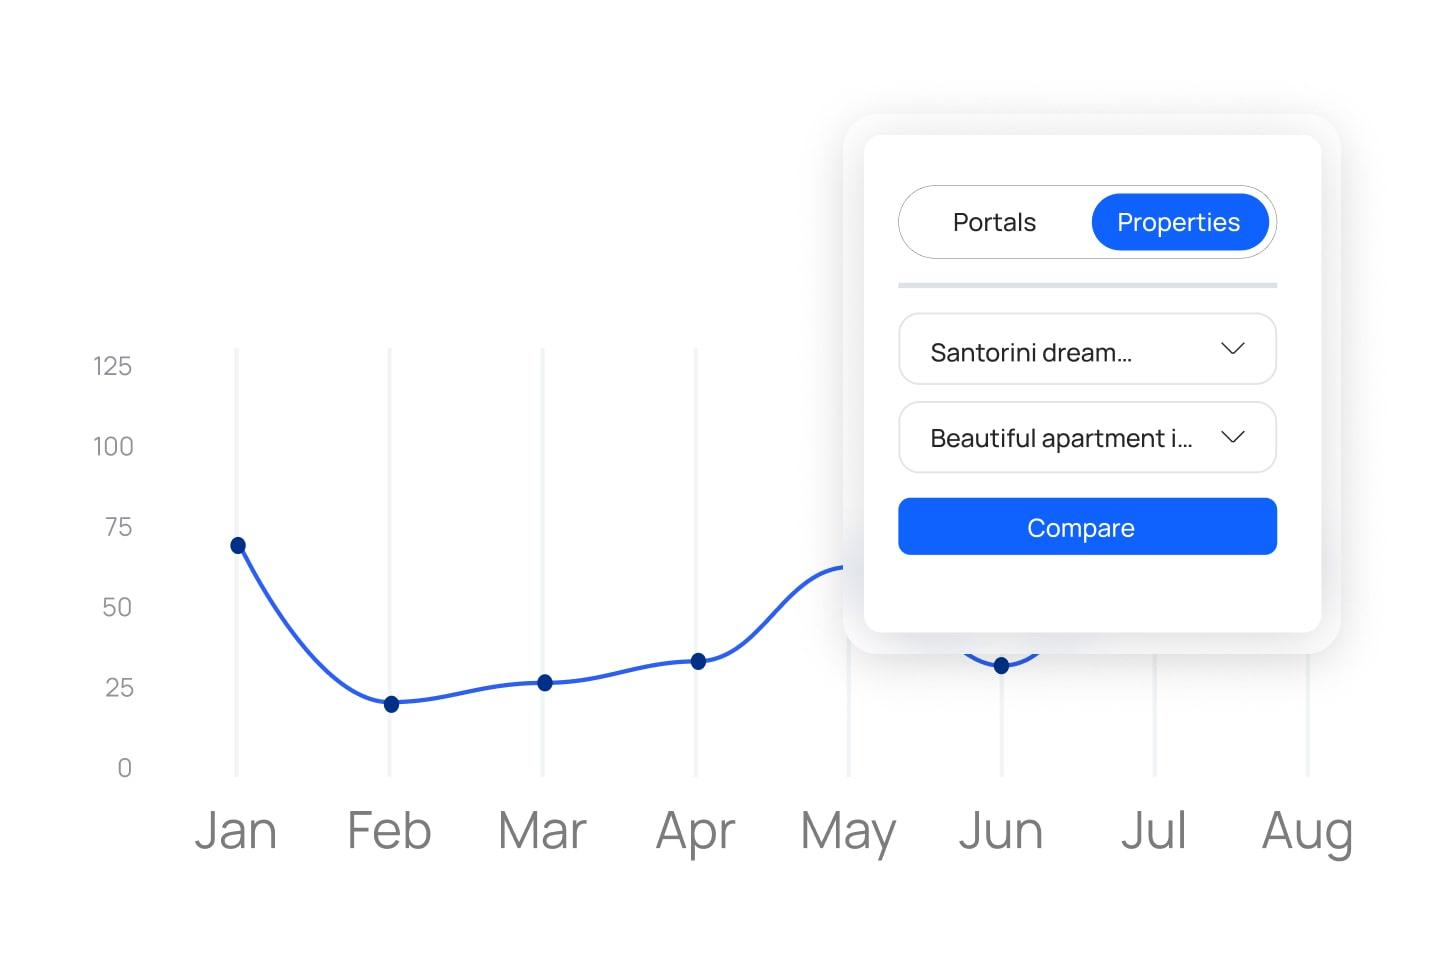
Drill down into the details
Filter by time range, access strategic data, and find actionable insights.
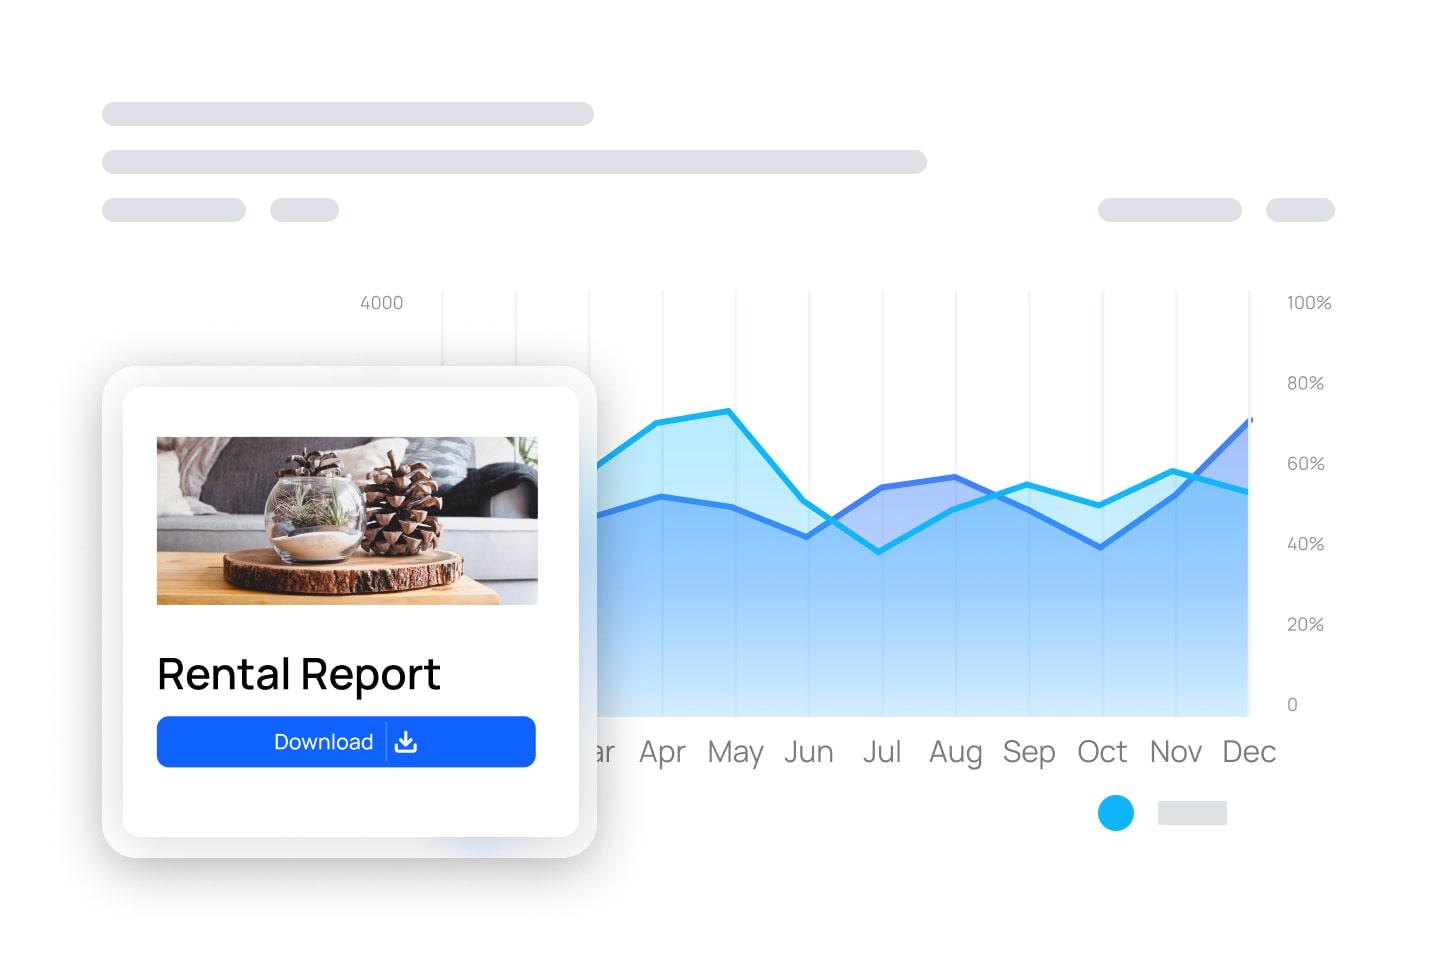
Reports
Create detailed reports
Generate PDF, Excel, or CSV reports to study your data in greater detail.
Every feature you need to succeed

Manage all your vacation rentals from a central point
at the single click of a mouse.

Focus on attracting new guests and retaining loyal guests
by designing and updating your own booking system.

Personalize your messages and schedule delivery
so information
is sent at the right time, every time.

Welcome everyone with a personalized Guest Guide full of
everything they need for a memorable stay.

Build a new revenue stream by attracting guests
directly
to your own personalized website.
Understanding the statistics and data
Learn just how crucial statistics are to becoming a successful host.
Have questions?
Statistics or KPIs (key performance indicators) enable you to visualize a trend based on collected data over a defined period and draw informed conclusions. The vacation rental data analytics will help you enhance your business's performance.
Use Smoobu's analytics tool to highlight data such as occupancy rate, average revenue, number of overnight stays, cancellation rate, etc, to make more informed decisions to optimize the management of your rental and its future success.
Calculate the occupancy rate of a vacation rental by following this formula:
Occupancy rate calculation: (number of nights booked / number of nights available) x 100For example, you have a vacation rental that is rented out on online booking platforms for 365 days a year. You have rented your vacation rental 287 nights out of 365. According to the occupancy rate formula seen below, we obtain the following calculation: (287/365)x100. Your average occupancy rate is, therefore, 78.6%. Track the occupancy rate directly in your dashboard.
Access your vacation rental analytics through dynamic widgets. For example, on channels such as Airbnb or Booking.com, you can quickly see the percentage of bookings per channel, the revenue per channel, and the nights per channel. You can also choose the type of graph you'd like to analyze: bar chart, pie chart, column chart, or pyramid chart."
Ready to simplify your workload?
14-day trial, no credit card needed!

