
Airbnb Average Occupancy Rate In The UK Market In 2025 And 2026

The vacation rental market across the United Kingdom is evolving rapidly. For property owners and managers, keeping a close eye on the right metrics has never been more vital. As we progress through 2025 and look ahead to 2026, the landscape is maturing. It is no longer just about putting up a listing and waiting for guests to arrive; it is about operating strategically in a competitive environment where guests have high expectations for quality, amenities, and service.
To maximize your revenue and ensure your vacation rental thrives, you need to deeply understand your local market and how your property performs within it. One of the single most important key performance indicators (KPIs) for any host is the Airbnb average occupancy rate.
In this comprehensive guide, we will break down exactly what the average occupancy rate is, why it is a critical metric for your business, and the latest statistics for the UK market in 2025 and 2026. We will also explore actionable strategies to improve your rate and highlight other essential metrics to track to stay ahead of the curve.
What Is Average Occupancy Rate?
At its core, the average occupancy rate is a straightforward calculation that indicates how full your vacation rental is over a specific period. It is the ratio of booked nights to the total number of nights your property is actively available for guests to book.
To calculate your occupancy rate, you simply divide the number of booked nights by the number of available nights, then multiply by 100 to get a percentage.
Occupancy Rate Formula:(Booked Nights / Available Nights) x 100 = Occupancy Rate %
For example, if your property is available for 30 nights in April, and guests book 21 of those nights, your occupancy rate for the month is 70%.
It is crucial to note that nights you have actively blocked off for personal use, maintenance, or deep cleaning should not be counted as "available nights." If you block your calendar for five days to paint the living room, your total available nights for a 30-day month drop to 25. If you secure 20 bookings during those 25 available days, your occupancy rate is 80%, not 66%. Understanding this distinction ensures your metrics accurately reflect market demand rather than your personal schedule.
Why Average Occupancy Rate Is An Important Metric For Hosts
Whether you manage a single cozy cottage in Cornwall or a portfolio of modern apartments in London, tracking your occupancy rate provides invaluable insights into the health of your hosting business. It is a foundational metric that impacts almost every aspect of your operations.
Predicting Revenue And Cash Flow
Occupancy rates are directly tied to your bottom line. By tracking historical occupancy data and comparing it with market trends, you can accurately forecast your future income. This predictability allows you to budget for expenses, plan for low seasons, and make informed decisions about reinvesting in your property. A stable occupancy rate provides the financial security needed to upgrade amenities or expand your portfolio.
Measuring Market Demand And Pricing Strategy
Your occupancy rate acts as a thermometer for your pricing strategy. If your occupancy rate is consistently hovering near 100%, it might seem like a reason to celebrate. However, it often indicates that your prices are set too low, leaving money on the table. Conversely, an occupancy rate that falls well below the market average suggests that your rates are too high or your listing is failing to attract potential guests. Finding the sweet spot between a healthy occupancy rate and a profitable base price is the key to maximizing revenue.
Improving Platform Algorithmic Ranking
Platforms like Airbnb prioritize properties that successfully convert viewers into guests. A healthy occupancy rate signals to the algorithm that your property is desirable, well-priced, and actively managed. High conversion rates often lead to better visibility in search results, creating a positive feedback loop: more visibility leads to more bookings, which sustains your occupancy rate and maintains your high ranking.
Balancing Wear And Tear
While a high occupancy rate brings in revenue, it also increases the physical wear and tear on your vacation rental. A strategic host understands that pushing for 100% occupancy every month can lead to property exhaustion, leaving no time for essential maintenance. Maintaining an optimal rate—often around 70% to 75%—allows you adequate turnaround time to ensure pristine cleaning standards, address minor repairs, and maintain the high-quality experience your guests expect.
The Statistics: UK Airbnb Market In 2025 And 2026
As we navigate 2025, the UK vacation rental market has matured significantly. The rapid, unbridled growth seen in previous years has stabilized, and supply is currently expanding beyond major cities into regional hubs. Market data from leading analytics firms like AirDNA indicates that the average occupancy rate for UK vacation rentals typically ranges from 65% to 70%. However, this figure fluctuates dramatically depending on the specific location, property type, and the level of professional management.
In 2025, major hubs and tourist hotspots continue to perform exceptionally well, while seasonal coastal towns experience more significant peaks and troughs. Based on recent market analysis, an average high-performing listing across major UK cities achieves roughly 70% occupancy with an Average Daily Rate (ADR) of around £110.
Average Occupancy Rates By UK City (2025 Benchmarks)
Here is a snapshot of average Airbnb occupancy rates across key UK cities, demonstrating the stark differences between urban centers, historical hubs, and seasonal destinations:
| City / Region | Average Occupancy Rate | Average Daily Rate (GBP) |
| Edinburgh | 85% | £139 |
| London | 74% | £136 |
| Glasgow | 74% | £104 |
| Cambridgeshire | 76% | £105 |
| Oxford | 78% | £99 |
| Bristol | 53% | £128 |
| Bath | 67% | £141 |
| York | 68% | £148 |
| Cornwall | 62% | £121 |
| Manchester | 54% | $141 (USD) |
| Birmingham | 59% | £105 |
| Liverpool | 54% | £93 |
| Blackpool | 47% | £100 |
Market Predictions For 2026
Looking ahead to 2026, industry experts and tourism boards like VisitBritain anticipate that the market will become even more focused on quality and operational consistency. With the total number of UK listings expected to remain highly competitive, guests will have abundant choices.
This means that generic listings will struggle to maintain high occupancy. Properties that differentiate themselves through premium amenities—such as dedicated workspaces, pet-friendly policies, and fast WiFi—along with flawless cleanliness and rapid guest communication, will capture the majority of bookings. In 2026, achieving a 70% occupancy rate will require hosts to be proactive, data-driven, and highly responsive to evolving guest needs.
How To Improve Your Occupancy Rate
If your property is falling short of your local market average, there are several actionable strategies you can implement to boost your bookings and fill your calendar consistently.
Implement Dynamic Pricing
Static pricing is a thing of the past. Demand fluctuates based on seasonality, local events, weekends, and holidays. By using Smoobu Dynamic Pricing, your nightly rates automatically adjust to match real-time market demand. During slow periods, your prices will slightly decrease to attract budget-conscious travelers and secure bookings. During high-demand periods, your prices will increase to maximize revenue without sacrificing occupancy.
Optimize Your Listing And Photography
Your listing is your storefront, and the photos are your window display. Ensure you have high-quality, professional photography that highlights your property’s best features. Write a compelling, accurate description that clearly outlines what guests can expect. Be sure to highlight amenities that drive bookings in 2025, such as fast WiFi, smart locks, or a well-equipped kitchen. A polished listing reduces friction for the guest and increases your booking conversion rate.
Raise Your Review Scores
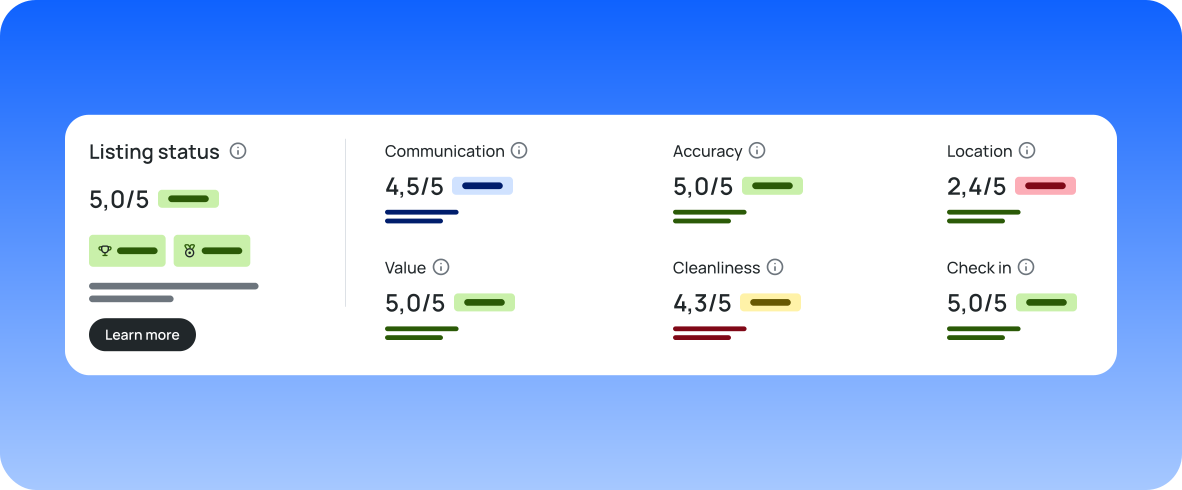
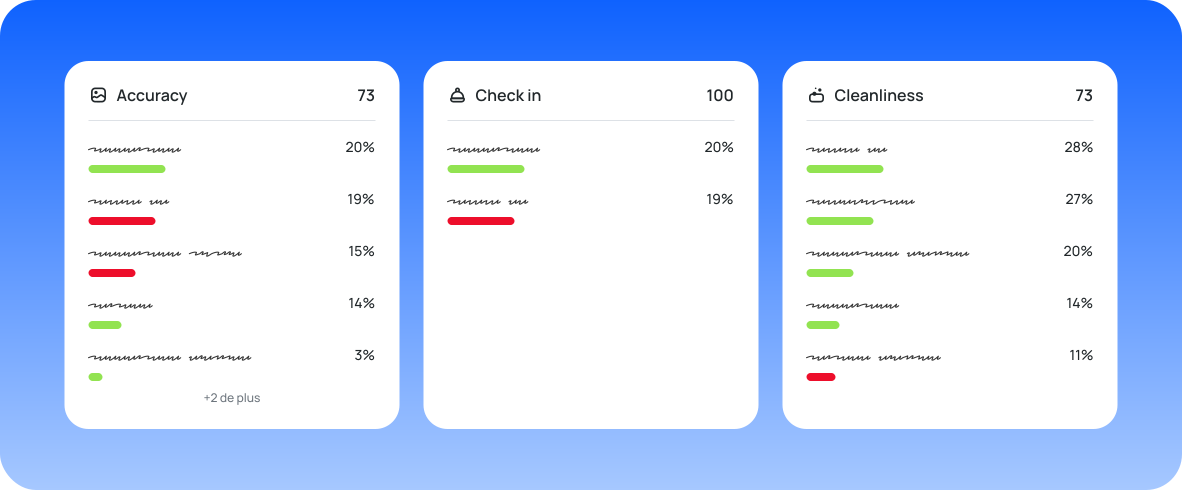
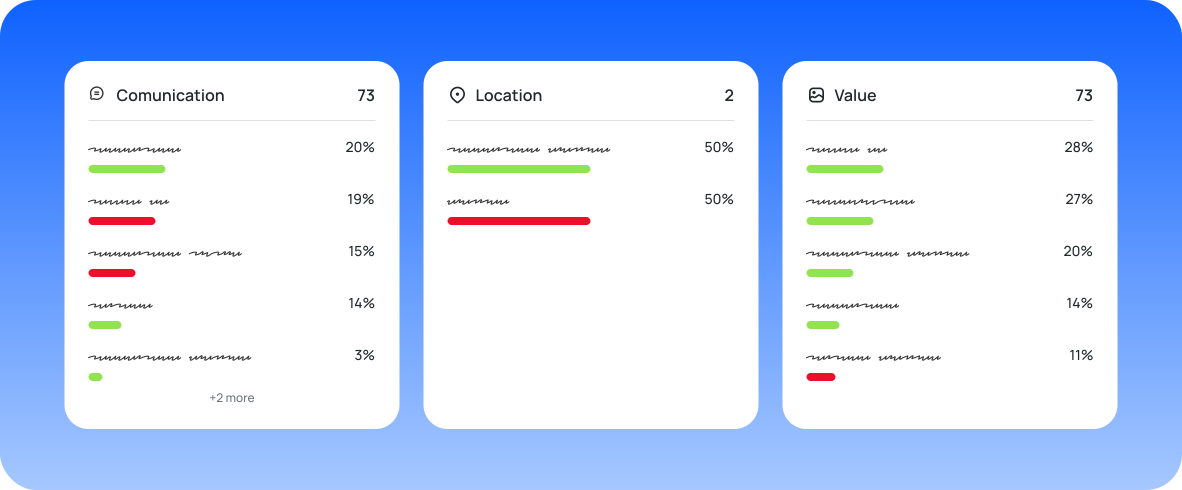
Reviews are the currency of the vacation rental industry. A listing with a 4.9-star average will almost always command a higher occupancy rate than a 4.5-star listing. Focus on the core pillars of hospitality: pristine cleanliness, seamless online check-in processes, and excellent communication. Responding quickly to inquiries and addressing issues immediately during a guest's stay will protect your review scores, which in turn protects your future occupancy rate.
Adjust Minimum Stay Requirements
Strict minimum stay requirements can severely limit your occupancy. If you require a three-night minimum stay, you are automatically filtering out a massive segment of weekend travelers and business guests. Consider adopting a flexible approach: require longer stays during peak summer and holiday periods, but reduce the minimum to 1 or 2 nights during the off-season to fill gaps in your calendar.
Target Mid-Week Travelers And Digital Nomads
Weekends often take care of themselves, but mid-week vacancies can easily drag down your overall average. To boost mid-week occupancy, try targeting remote workers and business travelers. Highlight your ergonomic workspace, high-speed internet, and coffee station. You can also offer slight discounts for mid-week stays to incentivize flexible travelers who can work from anywhere.
Leverage A Channel Manager
Relying solely on one platform restricts your visibility. By listing your property across multiple channels—like Booking.com, Vrbo, and your own direct booking website—you instantly put your property in front of millions of more potential guests. Using a reliable Channel Manager ensures your calendars sync in real time, preventing overbooking while maximizing your exposure.

Other Important Stats And Metrics To Track
While the occupancy rate is a vital indicator of success, it should never be viewed in isolation. To get a complete picture of your property's financial health and performance, you need to track several other key metrics alongside it.
Average Daily Rate (ADR)
Your ADR represents the average rental income per occupied room per day. It is calculated by dividing your total revenue earned by the number of nights booked. As mentioned earlier, a high occupancy rate is only valuable if your ADR is high enough to generate a profit. Balancing these two metrics is the cornerstone of effective revenue management.
Revenue Per Available Room (RevPAR)
RevPAR is arguably the most critical financial metric for hosts. It combines both occupancy and ADR to give you a clear picture of your property's overall performance. You calculate it by multiplying your ADR by your occupancy rate. RevPAR tells you how much revenue you generate for each night your property is available, whether or not it is booked.
Average Length Of Stay (ALOS)
The ALOS metric tracks the average number of nights guests stay at your property. A higher ALOS generally means lower operational costs (fewer turnovers, less cleaning, and reduced communication overhead) and a more stable income. Monitoring this metric helps you refine your minimum stay policies and tailor your marketing to the right type of guest.
Gross Booking Value (GBV)
Gross Booking Value measures the total monetary value of all guest bookings over a specific period before subtracting channel fees, cleaning costs, or taxes. Tracking your GBV provides a high-level view of your business growth and helps you understand your true market capture before operational expenses are deducted.
Conclusion: Measure Your Success With Smoobu
Navigating the competitive UK vacation rental market in 2025 and 2026 requires diligence, strategic thinking, and the right technology. As a host, you need to rely on concrete data rather than guesswork to make informed decisions about pricing, marketing, and operations.
This is where your property management software becomes an indispensable tool. With Smoobu’s integrated Statistics dashboard, you can easily track your occupancy rates, revenue, and booking portals in real-time. Our centralized platform takes the complexity out of data analysis, providing you with clear, actionable insights that empower you to self-manage your properties with confidence.
By leveraging smart software, automating your workflows, and optimizing your rates, you can ensure your calendar is seamlessly synchronized across all booking platforms. Stay proactive, embrace the data, and watch your occupancy rate—and your revenue—grow steadily in the years to come.